100 rolls is a staggeringly small sample size for a set with 20 possible outcomes, I would take this with a grain of salt (or a lot of salt in a glass of water? ;) )
In any case it's fun to do some experimenting like this, thanks for sharing!
So far 2 dice in and the new results are looking very interesting
It's going to be probably a couple days for the new results but I'll make a more detailed post for sure including the amount of times each number came up on each die
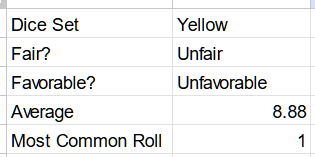
The null would be that it is a fair die (average roll 10.5). Your test is whether the true result is significantly less than 10.5 based on a sample of 100 with a mu of 8.8. Let's call it an alpha of 0.05
So we have to run a left tail one-sample t-test.
Unfortunately, this data set doesn't tell me the standard deviation -- but that could be determined in future trials. For now, we'll have to just make an assumption that the D20 is fair. For a fair D20, the standard deviation should be be sqrt( ([20-1+1]^2 -1)/12) or roughly sqrt(33.25)
We can run that t-test in a simply python script:
import numpy as np
from scipy import stats as st

h0 = 10.5

sample = np.random.normal(loc=8.88, scale=(np.sqrt(33.25)), size=100)

t_stat, p_val = st.ttest_1samp(sample, h0)


print(f"T-statistic: {t_stat:.4f}")
print(f"P-value: {p_val:.4f}")
Of course, I had to randomize this a bit since I don't have access to the full data from the true sample. That would make for a better bit of analysis. But at least assuming I didn't make a serious dumb here, 100 rolls averaging 8.88 would seem to suggest that the you can reject your null hypothesis of this being a fair die at a typical alpha of 0.05.
Then again, the way I wrote this script is GUARANTEED to be an unfavorable result since the way I randomized it REQUIRES the average end up 8.88, which is, of course, less than 10.5. Your real world testing would not have this constraint.
Basically he is giving you info on how to interpret the result you got. A t-test (Student's t-test) gives a "p-value" which sometimes comes up in some articles regarding a statistical result. It is a way of assessing whether the result you got is different enough from the expected value (a fair die) taking into account that you can't throw the dice an infinite amount of times. Generally a p-value less than 0.05 is considered statistically significant* and you can trust your result.
You can do the calculation here too if you want to get some values about it and more info.
*) Sort of means that there is only a 5% probability that your result is due to randomness.
If OP tested a thousand dice, and this is the one that came out on the bottom, then it's incredibly likely it's just random because of how many dice were tested.
MULTIPLE COMPARISON CHANGES THE RULES OF STATISTICAL HYPOTHESIS TESTING, and the OP is giving us a single result from multiple comparisons which are censored.
With one die we can calculate the probability of getting that result and compare it to a distribution of fair dice, that gives us a probability of 0.24% that the average of 100 rolls of a 20 sided fair die is 8.88 or lower.
Knowing op rolled 17 dice (17 sets of 100) we can calculate the probability of that even happening with fair dice to be around 4% meaning very likely that die is unfair.
I gave the tool a test using the data on the rolls I mentioned in the previous comment (under the spoiler tag) and it said "very statistically significant"

